Turn lab PDFs into structured values
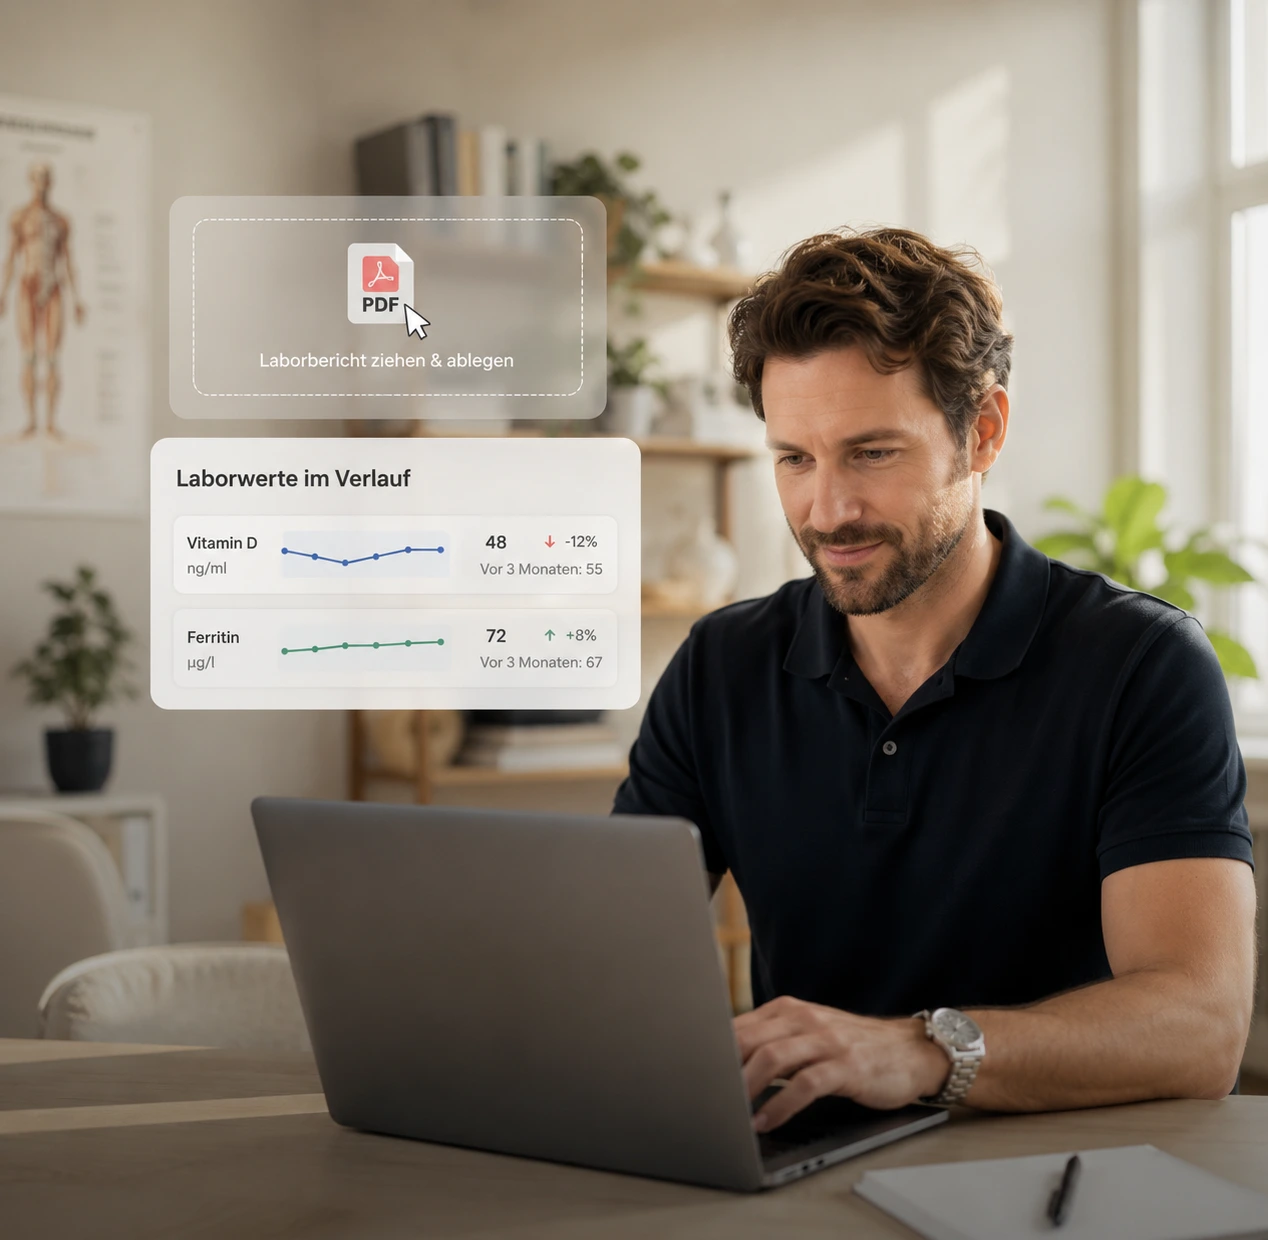
Capture parameters, values, units and reference ranges and combine multiple results into one longitudinal view.
What for
Every lab writes differently. Centi aligns it.
Names, units and reference ranges are mapped to one biomarker, so many PDFs become one trend.
What the module does.
PDF & scan+
Capture parameters+
Keep units explicit+
Capture reference ranges+
Review before approval+
Build longitudinal trends+
Trace back to source+
Values over time
How values change over months, with date and reference range for every result.
From PDF to trend.
Upload the lab report
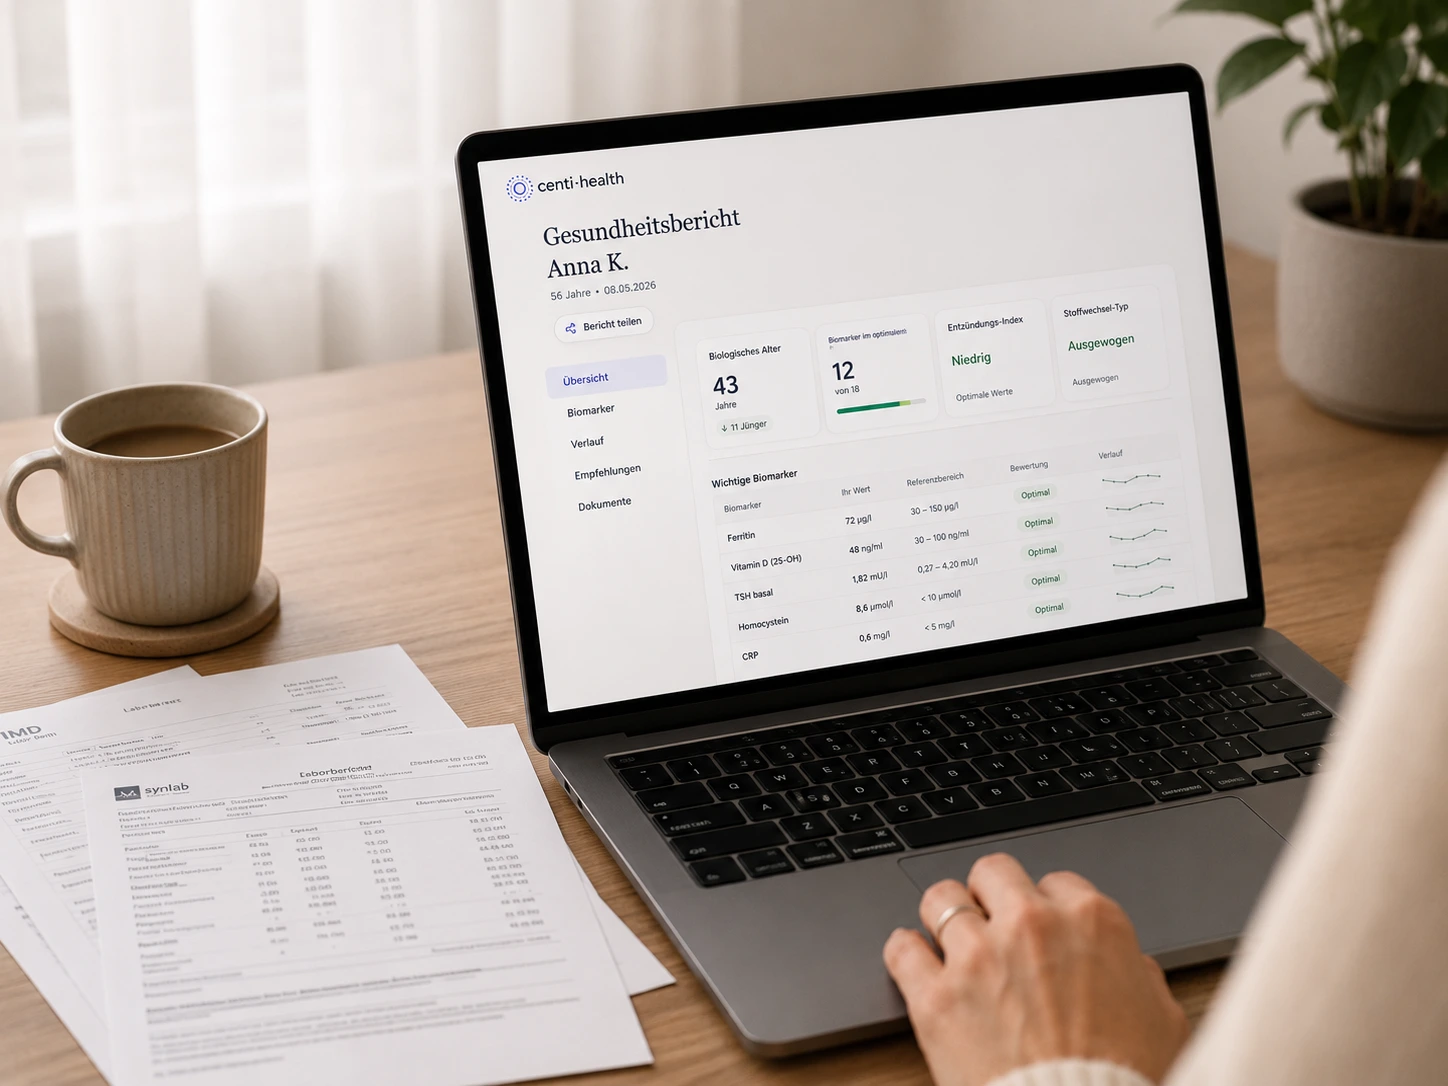
Assign a PDF or scan to the correct patient profile and keep it as the source document.
Structure the values
Capture parameters, values, units and reference ranges from the report and map them.
Review & correct
The practice compares detected data with the original report and corrects it where necessary.
- FerritinRef. 30–400 µg/l245µg/l+65
Approve for the trend
Approved values are placed into the longitudinal biomarker view by report date.
Without and with Centi.
| With Centi-Health | Manual work from lab PDFs | |
|---|---|---|
| Data capture | Upload the report and review the detected structured data. | Retype parameters and values from every report. |
| Reference ranges | Store the measured value together with the lab-specific reference range. | Look up the relevant range again in each PDF. |
| Units | Keep units structured with each value and account for them in the longitudinal view. | Different units make direct comparison harder. |
| Historical results | Combine approved values by date in the biomarker timeline. | Open old PDFs and compare measurements manually. |
| Traceability | Keep structured values linked to the original source document. | Spreadsheet values and source documents often live separately. |
Frequently asked questions
Centi-Health structures the parameter name, measured value, unit and reference range. Detected information is shown for review before approval and can be corrected.
Yes. Scanned documents can be processed in addition to digital PDFs. With scans, source quality matters especially, so detected values should be reviewed carefully before approval.
Detected data can be edited before approval. The practice can correct the parameter, value, unit or reference range by comparing it with the original report.
Yes. Historical results can be assigned to a patient. After review and approval, their values are placed into the relevant biomarker timeline according to the report date.
Yes. The structured result remains linked to its source document so the captured information can be traced back to the original whenever necessary.
Yes. Approved lab values and longitudinal trends can be used as input for a patient report in Centi-Health and supplemented with the practice's professional assessment.
What goes with it.


Capture lab values in a structured format
Upload a report, review detected values and combine them into longitudinal biomarker views.
Then €29.99 per month excl. VAT · cancel monthly
Cancel monthly · primary patient data in Frankfurt · DPA available